Understanding Your Analytics
How to read the Overview and Feedback pages — what the metrics mean and what to do about them.
RateMind's analytics is intentionally simple. There's no funnel chart, no cohort analysis, no machine-learning-driven anything. The decisions you make from feedback are mostly judgment calls based on individual customer comments — so the dashboard's job is to surface those comments and let you read them.
This article walks through what each piece of the Overview and Feedback pages shows you, and how to use it.
The Overview page
This is your dashboard home. Open it from the Overview link in the sidebar (it's the first item). You land here right after logging in.
Top metrics
Four cards across the top:
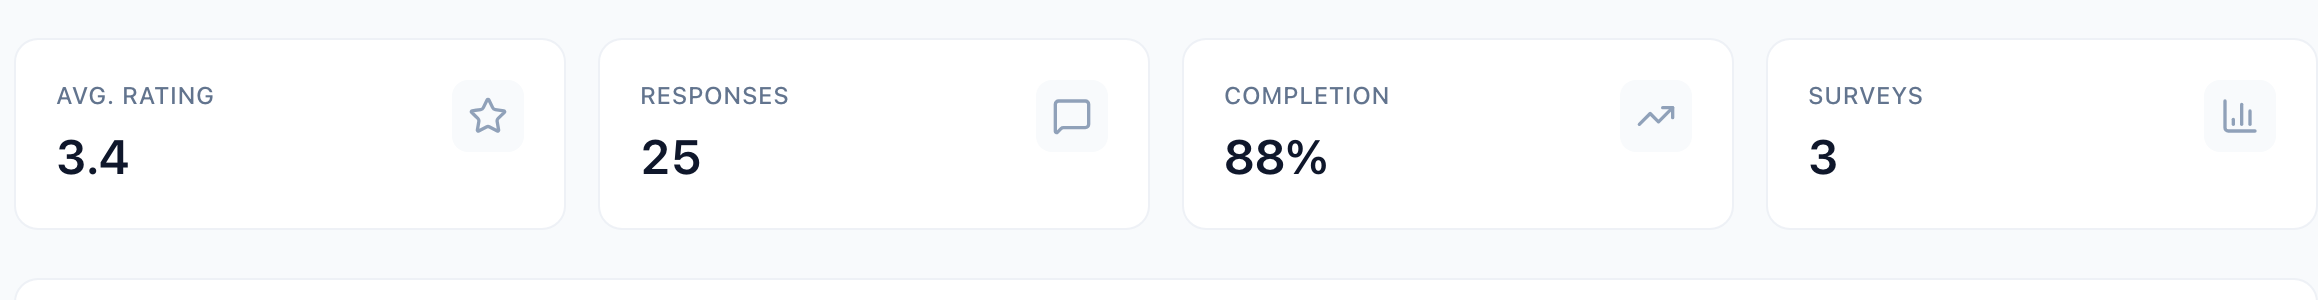
- Avg. Rating — the mean of all star ratings across all of your surveys, all time. Includes ratings from both routed-out (4-5) and routed-in (1-3) customers, so this is your *true* average — not your public Google/Trustpilot average. It will almost always be lower than your public rating, by design.
- Responses — total count of feedback entries received. Counts both complete and incomplete responses. Useful as a volume-over-time signal — if it stalls, your collection methods aren't working.
- Completion — percentage of started surveys where the customer actually finished. A low number (below 60%) usually means the survey is too long or has too many required questions. See [Using the Form Builder](/help/survey-form-builder) for question-count guidance.
- Surveys — total active surveys on this account. Mostly a status indicator — confirms you have what you think you have.
Recent Feedback
Below the metrics is a list of the most recent feedback entries.
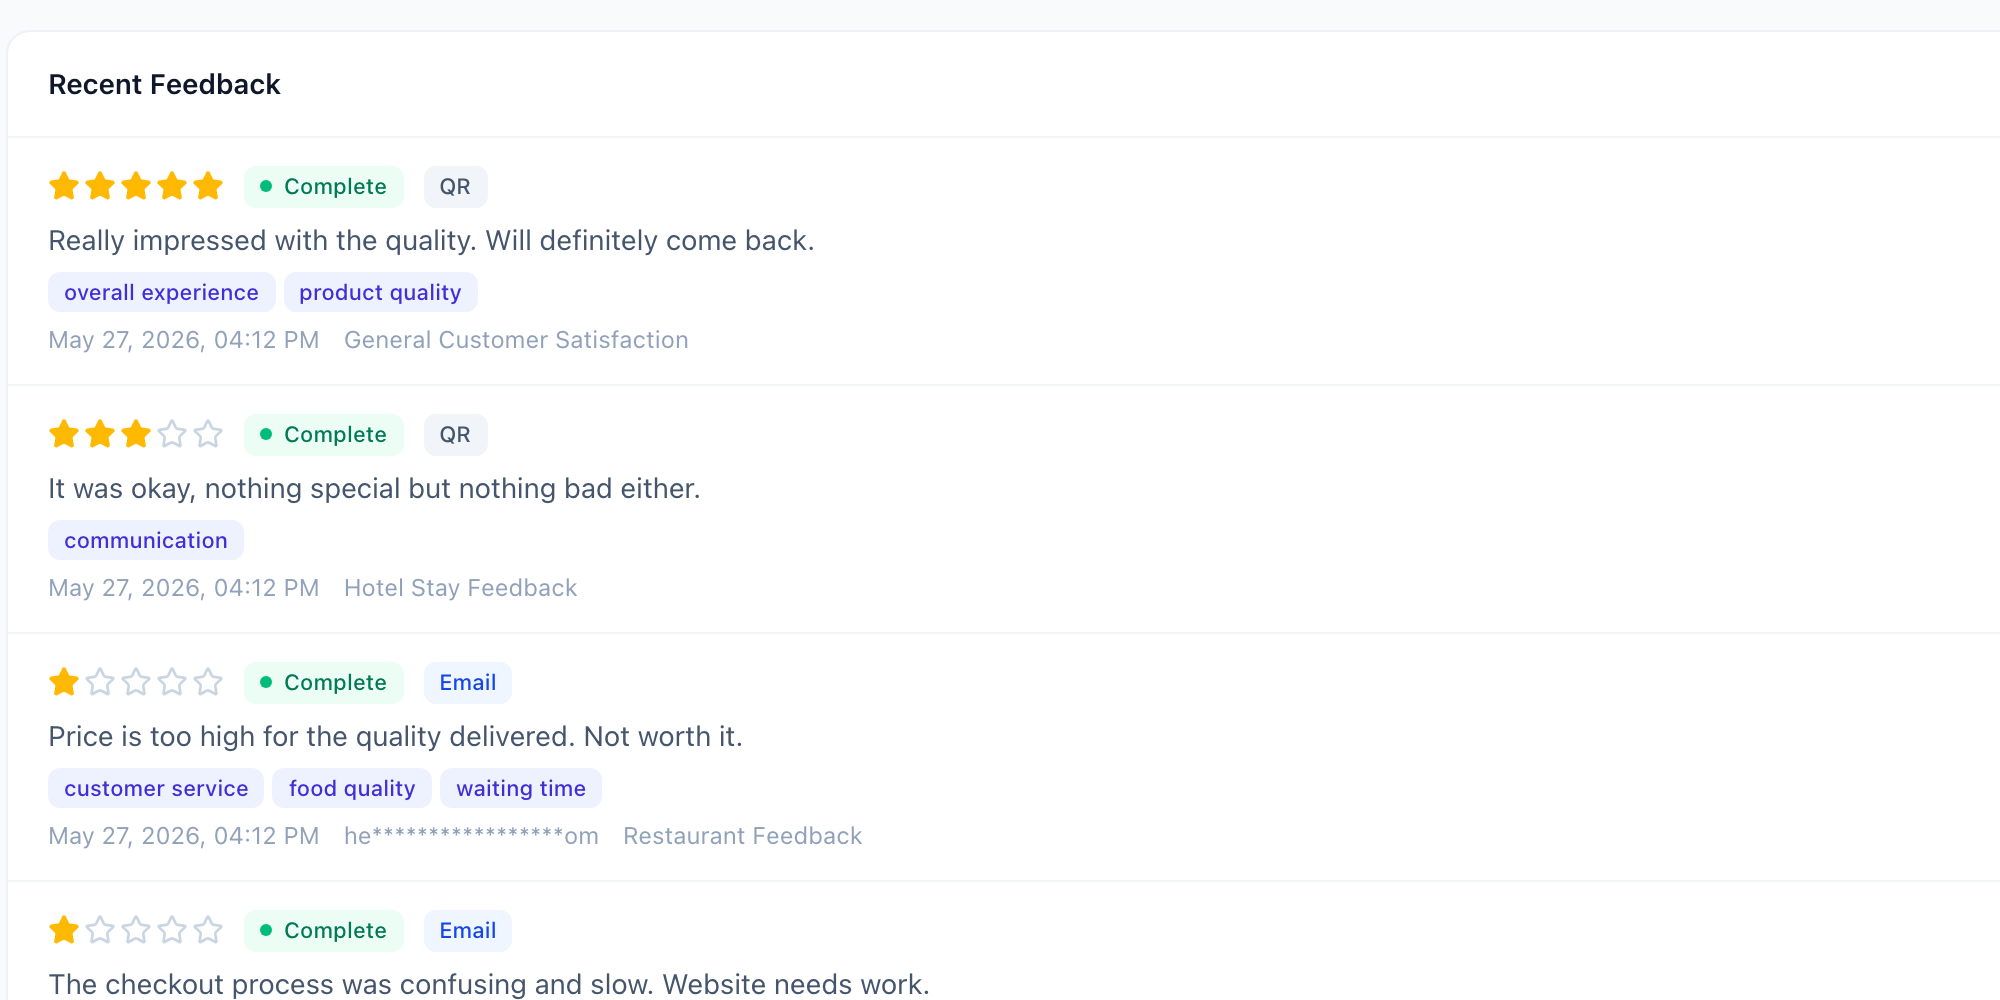
Each row has:
- Star rating — what the customer gave you (1-5)
- Status — Complete (answered all required questions) or Incomplete (dropped off)
- Source — Email (BCC), QR (scanned), or Direct Link
- Comment — the first free-text answer they gave, truncated
- Topic badges — labels RateMind extracted from their comments (more below)
- Timestamp + survey name — when, and which survey
The most important rows are the 1-2 star Email entries. Those are customers who emailed you, then rated low, then probably told you exactly what went wrong in a comment. Read those first. Often the rest of the day's product decisions follow from those two or three rows.
Topics — what they are and why they matter
RateMind reads customer free-text comments and pulls out recurring nouns or noun phrases ("waiting time", "food quality", "staff training", "delivery"). These appear as the purple badges under each feedback entry.
The same topics show up across many entries — that's the whole point. When you see "waiting time" appear seven times in a week, you don't need to read every comment to know what your problem is. You read one or two and act.
Topics are extracted algorithmically (no LLM, no API call to OpenAI — it runs on our server). They're not perfect; sometimes you'll see a topic that doesn't fully make sense. Trust the patterns, not individual labels.
The Feedback page
If the Overview is the at-a-glance view, the Feedback page is the full list. Click Feedback in the sidebar.
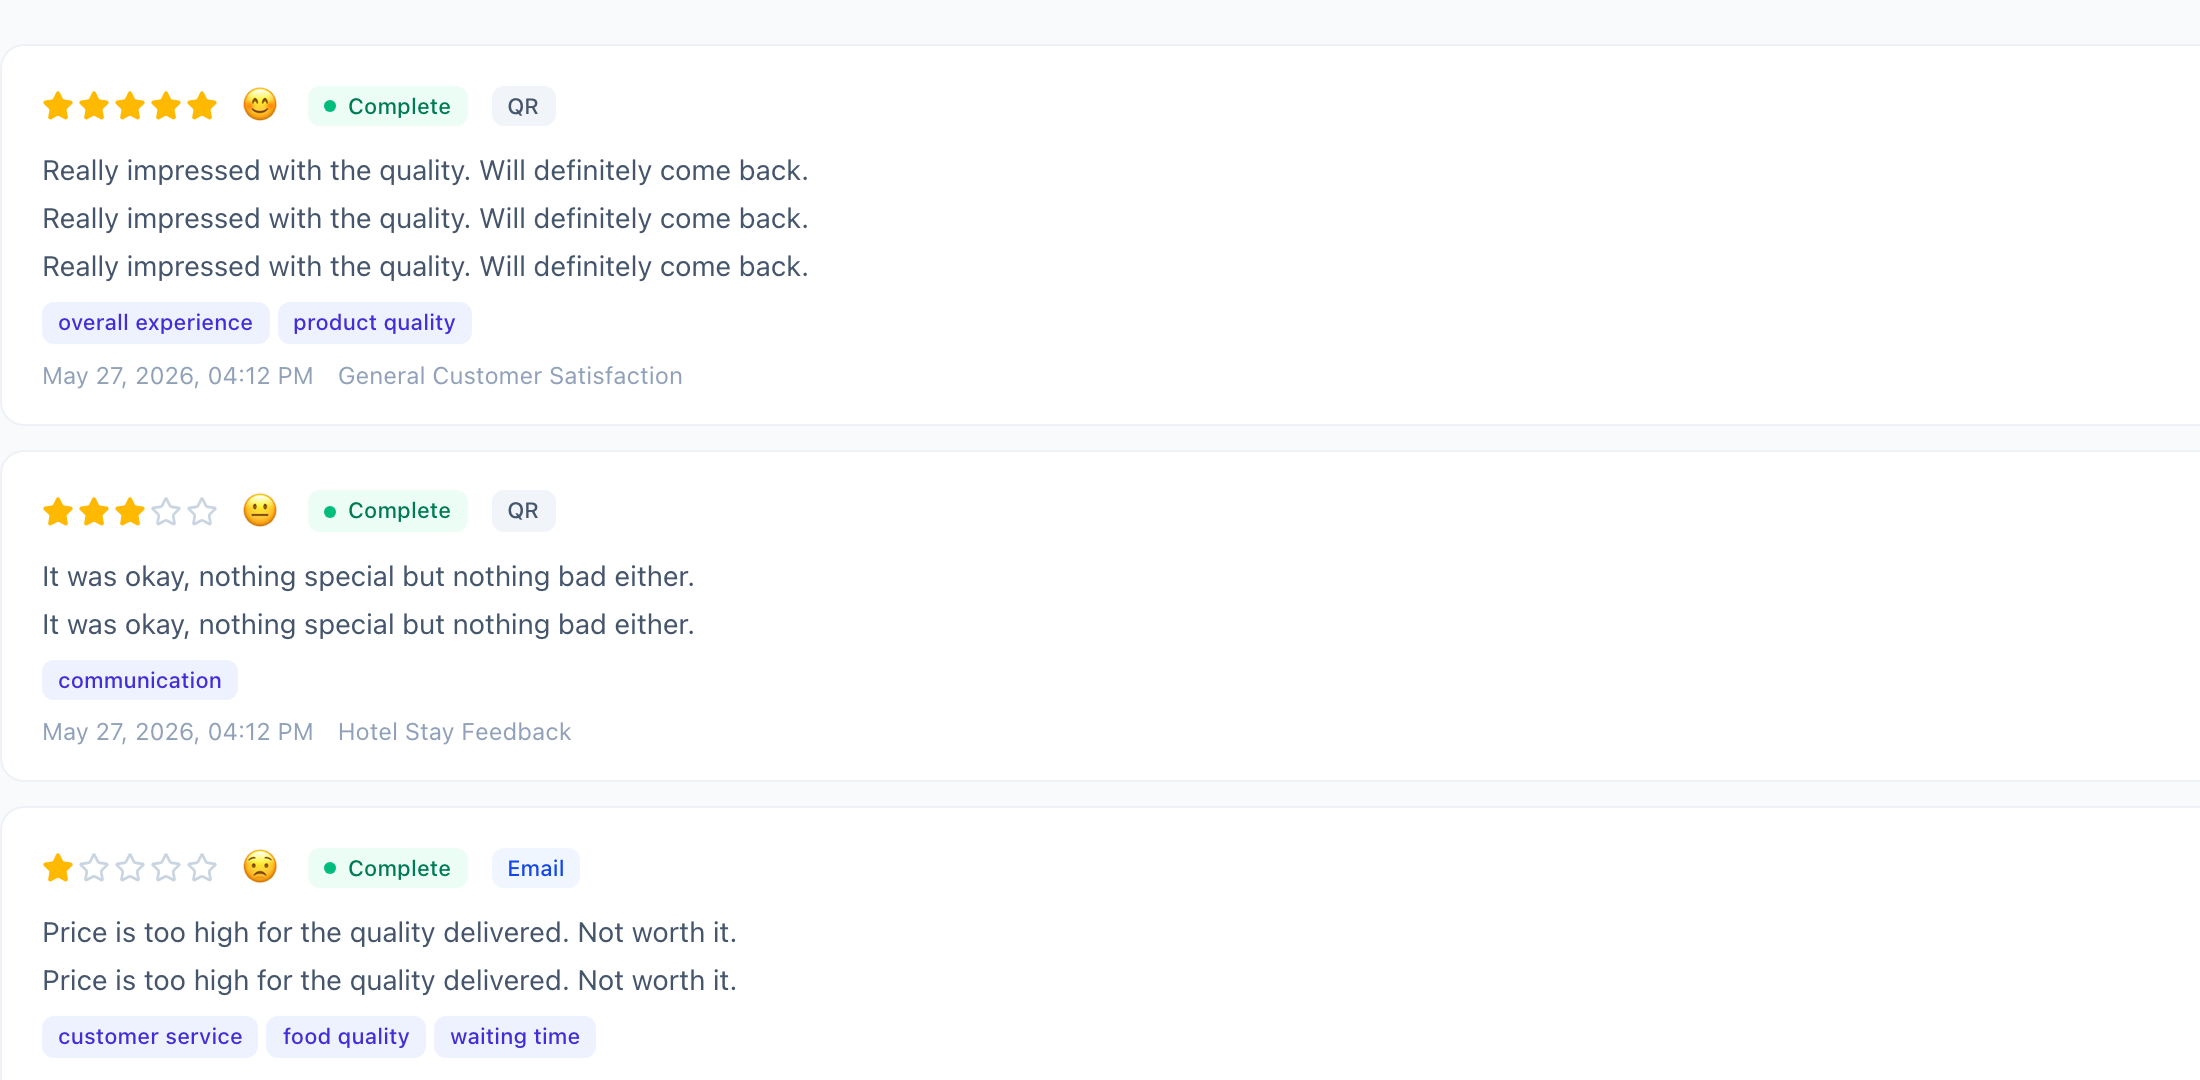
Same data as Recent Feedback, but unlimited and with full comment text (not truncated). Use this when you want to read through a batch — say, every 1-2 star response from the last month.
A few things to notice:
- Email addresses are masked (
heom). The full email is encrypted in the database and is never decrypted in your dashboard — we can't show it to you even if you ask. This is the [AES-256-GCM encryption posture](/help/email-bcc-setup#privacy-and-security) we apply to all PII. - Emojis on the rating row match the rating style configured on each survey (smiley face for high, frown for low). Helps scan a long list visually.
- Incomplete entries are kept and shown. They count toward Responses but not toward the Avg. Rating *only if* they didn't reach the rating step.
What to actually do with this data
Resist the urge to optimize for the Avg. Rating number. That number is largely outside your direct control week-to-week; it moves slowly with operational changes.
Instead:
- Once a day, scan the Recent Feedback for any new 1-2 star entry. Reply or take action while the issue is fresh.
- Once a week, open the Feedback page, filter your attention to topics that are *trending up*. If "waiting time" went from 2 mentions a week to 8, that's the operational problem to fix.
- Once a month, check Completion. If it dropped, your survey got worse — too long, too many required, confusing question. Tighten it.
That's basically the full workflow.
What's next
- [Creating and Configuring Surveys](/help/creating-surveys) — adjust threshold to balance public-review protection vs. data volume
- [Using the Form Builder](/help/survey-form-builder) — better questions = better topics = clearer decisions